

Filtering is one of the most common methods of data modelling. Without specific filtering, viewing a multi-page report can be difficult to manage. Using DAX filters, especially for financial statements, simplifies data sharing and visualisation.
In this article you will see :
- The usefulness of DAX filters
- How to filter data with the "FILTER" function
I. The usefulness of DAX filters
The use of DAX filters is necessary for several reasons:
- Filtering data according to associated values
- Return specific data types
- Search for values in related tables
DAX (Data Analysis Expressions) is a calculation expression language. It groups several categories of functions and simplifies the creation of formulas in Power BI. Numerous filter functions such as "FILTER" allow complex and repetitive calculations to be performed.
Below is an example of a report with the filtering of a target product by sales:
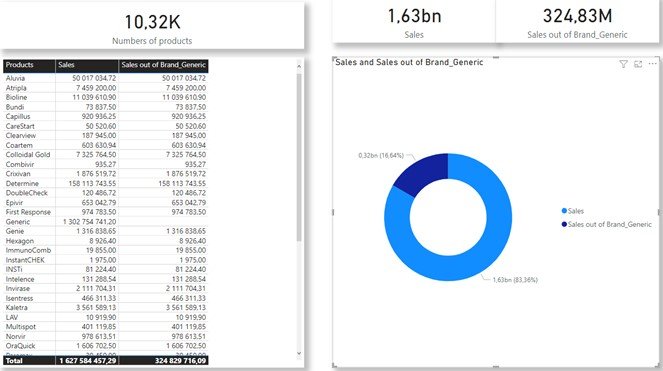
We will take this type of example and show how to filter data with the "FILTER" function.
II. How to filter data with the "FILTER" function
In the category of filter functions, the "FILTER" function is one of the most recurrent. This function allows standard calculations to be performed by displaying a table that has already been filtered. This type of filtering is usually based on a dynamic calculation and all rows of the table concerned can be filtered. Some common functions: CALCULATE; ALL; EARLIER; etc.
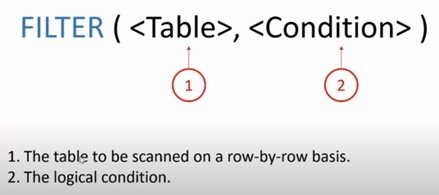
An example of syntax with the "FILTER" function:
Case study:
Our objective is to compare the total sales and the sales of a target product of a B2B company. This filtering method allows specific values to be displayed based on the overall data in a dynamic way.
For this case, we will choose a small sample of data but you will be able to load your own data for the same filtering method.
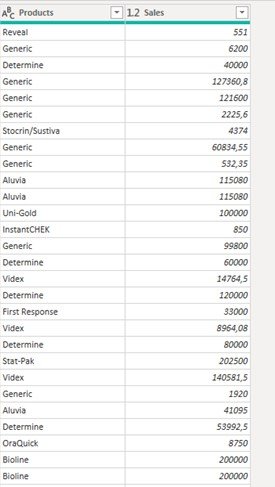
Below is an overview of the sample data:
Here are the steps to follow to do a filtering with "FILTER":
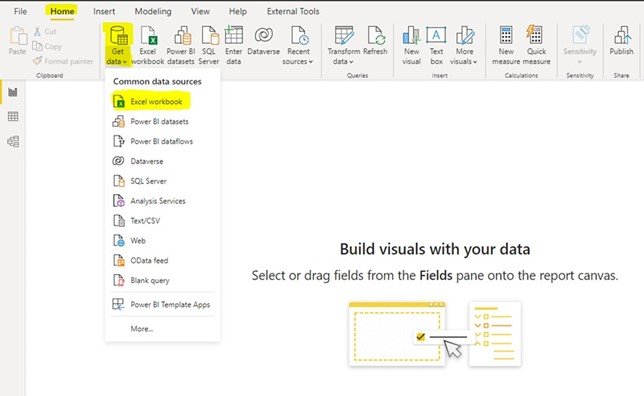
1. In Power BI Desktop :
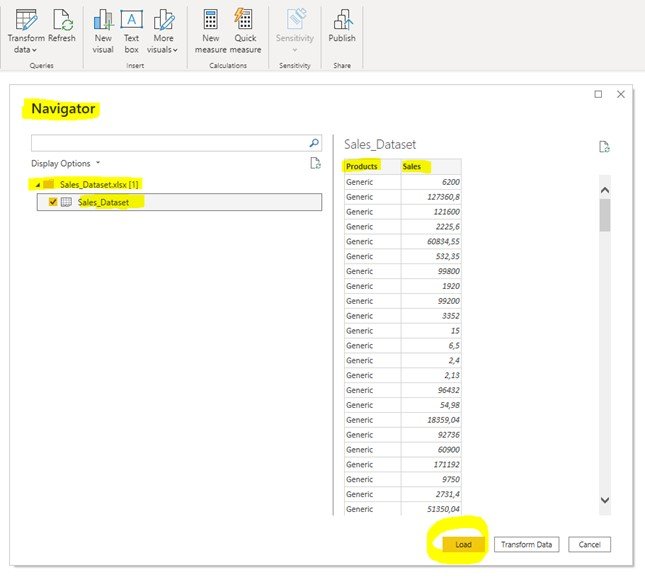
1.1. To start, open the main page of Power BI Desktop and choose the source of your data. In our example, we will use an Excel file:
1.2 After opening your data source, select and load the file to be analysed. Example: "Sales_Dataset
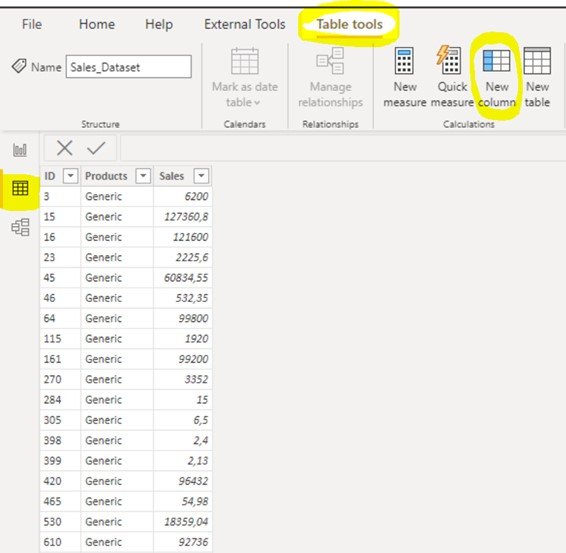
1.3. In the "Data" mode, you will see the table below containing the data from the Excel workbook. Select the "Table Tools" tab in the home bar and open the "New Measure" option.
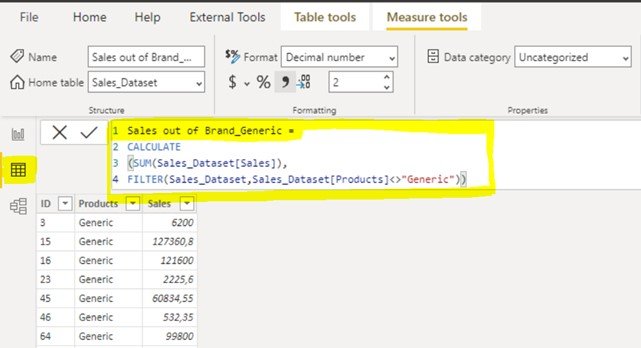
1.4. In the calculation area, create the following formula:
Sales out of Brand_Generic =
CALCULATE
(SUM(Sales_Dataset[Sales]),
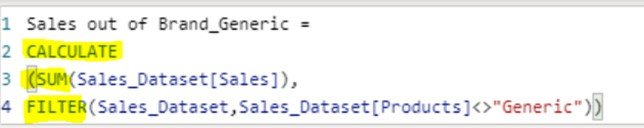
FILTER(Sales_Dataset,Sales_Dataset[Products]<>"Generic"))
1.5. Remember that this filter is not independent, it is included in another function that uses a table as an argument. Example: CALCULATE and SUM
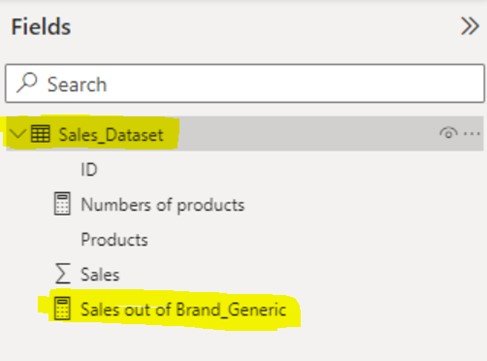
1.6. After the creation of the formula, this is the new measure created:
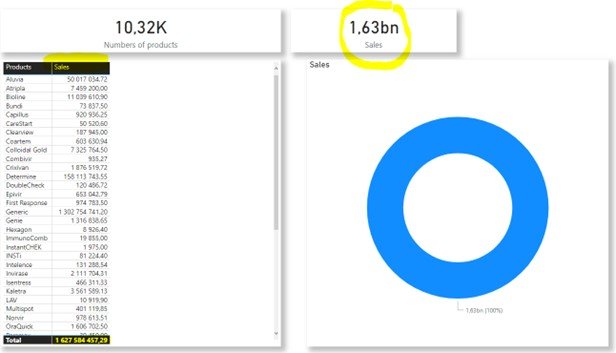
1.7 Finally, the data visualisation stage:
- Before filtering :
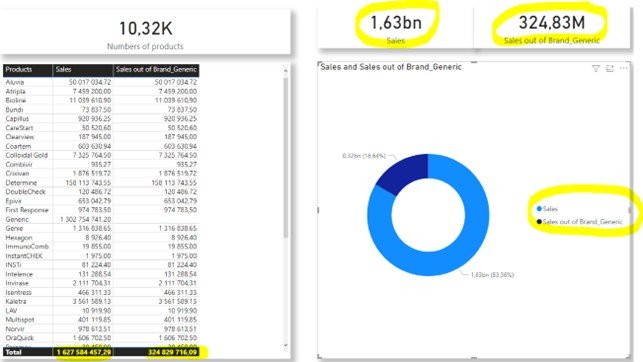
- After filtering :
Conclusion:
In summary, filtering in DAX is a simple and convenient way to display specific data. Through a sample of data, we were able to calculate the sales of a target product against total sales and make comparisons for the sales team. Depending on your needs, this method can be applied using the other filter functions available.
See more :
- Analyzing data with Power BI: Link 01
- Customer Insights - How to get a customer data source : Link 02
- DAX Guide - filtering functions : FILTER : Link 03
Thank you for reading,
Fodé DIABY
---
#filtering
#analysis
#powerbi
#DAX
#data